How to automate SEO reporting and dashboards
Quick Answer: To automate SEO reporting and dashboards, centralize Google Search Console, GA4, and any rank-tracking data; standardize metrics; and…

laptop displaying an analytics dashboard with charts
Last updated: October 12, 2026
Key Takeaways
- A dashboard only works when monthly numbers use the same definitions.
- Build the SEO reporting pipeline in four parts: sources, rules, dashboard, delivery.
- Pick tools by data complexity, not by brand familiarity.
- Start with one dependable dashboard, then clone its structure for other sites.
Quick Answer: To automate SEO reporting and dashboards, centralize Google Search Console, GA4, and any rank-tracking data; standardize metrics; and publish them through a scheduled dashboard refresh. For most teams in 2026, that means a connector plus Looker Studio for simpler setups, or BigQuery plus a BI tool for more complex ones. If you need to know how to automate SEO reporting and dashboards, the practical answer is to build one reliable pipeline first and only add complexity when the reporting logic demands it.
If you need SEO reporting that updates itself every day, the answer is to centralize your data, define a small set of repeatable metrics, and push them into a dashboard tool that refreshes on schedule. That usually means Google Search Console, Google Analytics 4, and a rank tracker feeding Looker Studio, Power BI, or another BI tool through a connector such as Supermetrics, Funnel, Windsor.ai, or native APIs. For Google’s own documentation on these products, see Search Console help, GA4 help, and the Looker Studio Help Center.
What Actually Determines the Right Answer Here

If your real problem is “I spend half a day every month building the same SEO report,” then the right automation is not fancy analysis; it is removing manual data pulls and fixing metric definitions first. A dashboard is only useful when the numbers mean the same thing every month. If you change the definition of organic sessions, branded clicks, or landing-page conversions midstream, automation just makes the confusion faster.
The first decision is how many data sources you actually need. If you only report on Google Search Console and GA4, Looker Studio is often enough. If you need blended channel data, client-by-client permissions, or heavier transformation, a warehouse plus BI layer makes more sense. If you need an executive view, you want fewer than 10 core metrics. If you need operational SEO work, you may need 20 to 30, but only if each one drives a decision.
The trade-off is simple: easier tools are faster to launch, but harder to standardize across multiple sites. More technical stacks take longer to set up, but they handle tagging rules, joins, and historical consistency better. That matters when you’re comparing 12 sites, not one.
Here’s the basic decision map:
| Situation | Best Path | Why Other Options Fail |
|---|---|---|
| Solo consultant with 1–3 sites | GA4 + GSC + Looker Studio + one connector | A warehouse is usually too much overhead |
| Agency reporting 10+ clients | Connector + standardized template dashboards | Manual exports break as soon as volume rises |
| In-house team with multiple channels | Warehouse + BI tool | Spreadsheet-based reporting becomes fragile |
| Need technical SEO + business reporting | Split dashboard layers | One dashboard rarely serves both audiences well |
If you are still deciding, start with the cheapest path that can survive 6 months of growth. A connector plus Looker Studio is often enough until the reporting logic gets messy. If it does, graduate to a warehouse before the spreadsheet sprawl becomes a cleanup project.
Quick check: if your monthly reporting still starts with CSV downloads, you are not ready for advanced automation yet; if your metrics already live in one place, you are.
How do you automate SEO reporting without breaking the numbers?
You automate SEO reporting by building a pipeline in this order: source data, transformation rules, dashboard layer, and delivery schedule. If you skip the transformation layer, the dashboard looks automated but still needs manual repair. That is the trap most generic advice misses.
A clean setup usually looks like this:
- Pull raw data from Google Search Console, GA4, Google Ads if paid search matters, and rank tracking if you use one.
- Standardize dimensions such as landing page, query, device, country, and date.
- Decide which metrics are source-of-truth metrics and which are convenience metrics.
- Build one dashboard template with locked formulas and filters.
- Set refresh timing that matches the source lag. GSC is not real-time, and GA4 is not the same as an ad platform feed.
- Add alerts for anomalies instead of staring at the dashboard every day.
For most SEO reporting, I would choose Looker Studio for presentation, a connector for data access, and a spreadsheet or warehouse only if you need custom calculations. Google Sheets alone can work for a tiny operation, but it tends to crack once you need multiple properties, historical snapshots, or permissions.
The biggest mistake is automating a bad report. If your current monthly deck has 40 slides and nobody changes decisions based on 32 of them, do not build an automated version of all 40. Cut the dead weight first. A focused dashboard should answer: What changed? Why? What do I do next?
Another common failure is mixing rankings and business results in a way that implies causation you cannot support. A ranking gain is not the same thing as revenue. If you report both, keep them in separate sections and connect them with the specific landing pages, not a vague uplift claim.
Quick check: if your current report needs a human to explain every graph, automation will magnify the confusion; if the next action is obvious from the metric, you are on the right path.
What tools should I use for SEO dashboards?
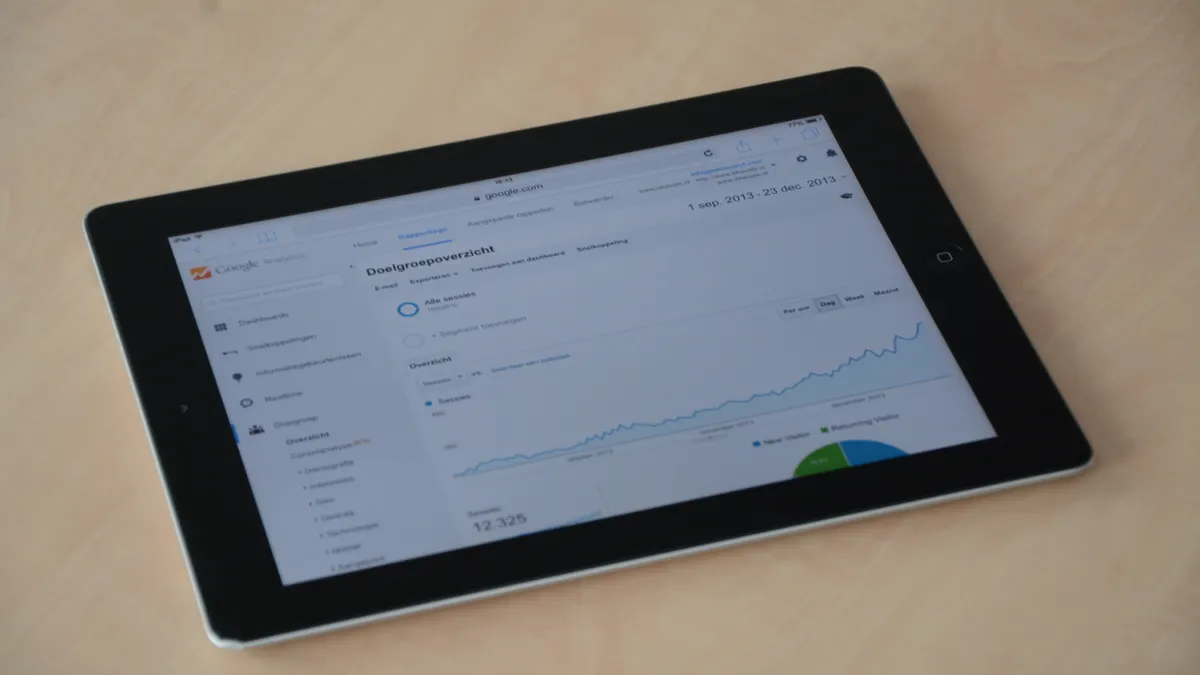
Choose the tool based on data complexity, not brand familiarity. If your job is to show SEO performance to a client or manager every week, Looker Studio is often the fastest path. If you need deeper modeling, Power BI or Tableau gives you more control. If you need automated SEO data collection from multiple sources, connectors such as Supermetrics, Funnel, and Windsor.ai save time, but they add recurring cost and another vendor to manage.
The honest trade-off is that connectors are convenient and not free in practice. They reduce manual work, but they can become the largest ongoing expense in the stack if you report across many properties. A direct API build lowers tool dependency, but it usually requires engineering time and maintenance that most SEO teams do not have. According to Google Search Console documentation, the data itself also has reporting delays, so refresh timing matters as much as the dashboard tool.
If you are comparing tools, use this rule:
- If the report audience is non-technical and the stack is small, use Looker Studio.
- If the dataset is large or you need row-level joins, use a warehouse like BigQuery with a BI front end.
- If you need flexible finance-style reporting, Power BI often fits better than a marketing-only dashboard.
- If you need fast setup across many sources, a connector is often worth it.
Do not pick a tool because it has a prettier chart library. Pick the one that handles your messiest recurring task. For many teams, that task is joining Search Console query data to GA4 landing pages and keeping the mapping stable month after month.
One useful benchmark is practical, not technical: if a report still needs more than 30 minutes of manual cleanup after refresh, the stack is not automated enough. Either the sources are not standardized, or the dashboard is asking the tool to do work it was never meant to do.
Quick check: if your main need is weekly visibility, not custom data science, a connector plus Looker Studio is probably enough; if you need cross-channel modeling, go heavier.
How do I set up an automated SEO dashboard step by step?
You set it up by building one reliable dashboard first, then copying that structure to other sites. If you try to automate five dashboards at once, you will spend your time debugging inconsistency instead of creating a usable system.
Use this path for a single brand or site:
- Pick the one business question the dashboard must answer, such as “Which landing pages are losing organic clicks but still converting?”
- Choose one source for each metric: GSC for clicks and impressions, GA4 for sessions and conversions, and a rank tracker only for visibility context.
- Set a naming standard for pages, folders, country views, and date ranges before any data flows into the dashboard.
- Connect the sources through a connector or API, then verify the same date range returns the same totals across tools.
- Build one top-level summary, one landing-page table, and one query or keyword view. Stop there until each one is trustworthy.
- Schedule refreshes to match source lag. Daily is fine for most SEO dashboards, but a source that updates slowly should not pretend to be real-time.
- Add one alert for a meaningful drop, such as clicks down sharply week over week or a conversion page losing traffic.
- Document the metric definitions inside the dashboard so nobody has to guess what “organic” means.
If you manage multiple sites, the process changes only after step 4. Then you should create a master template, map fields consistently, and keep the page grouping logic identical across properties. That is the difference between scaling and copying chaos.
A simple stack can be enough here. For example, Search Console + GA4 + Looker Studio + Supermetrics is a common pattern for a marketing team that wants automation without building infrastructure. A more technical stack would be Search Console and GA4 into BigQuery, then Looker Studio or Power BI on top. The second path is more work up front, but it is better when you need historical snapshots or advanced joins.
Quick check: if your dashboard cannot be rebuilt by someone else from your notes in 1 hour, your setup is still too fragile.
What gets automated, and what should stay manual?
Automate recurring pulls, not interpretation. If the task is “collect all clicks by page every Monday,” automate it. If the task is “decide why clicks fell on five pages,” leave that to a person. Generic articles often pretend dashboards replace analysis. They do not.
A good automation stack handles these things well:
- pulling monthly or daily performance data
- updating fixed charts and tables
- flagging anomalies
- sending scheduled snapshots by email or Slack
- preserving historical trends without manual exports
A bad stack tries to automate judgment calls such as:
- which page deserves a rewrite
- whether a ranking loss is caused by intent mismatch or a technical issue
- whether a traffic change matters business-wise
That distinction matters because SEO data is noisy. A 7-day dip is not always a trend. If you automate alerts without thresholds and context, people stop trusting the dashboard. If you build a threshold, make it modest and tied to a business outcome, not vanity metrics. For example, a drop in organic conversions on revenue pages is more important than a small shift in average position.
This is also where permissions and governance matter. A reporting dashboard should not let everyone edit formulas. Keep one owner for metric logic, and give viewers read-only access. If you are in a regulated industry or reporting to finance, ask the data team to sign off on definitions before you publish anything widely. For finance-adjacent teams, that discipline is closer to a control process than a marketing preference.
Quick check: if you are automating a report that people use to decide budgets, keep the data pull automated and the interpretation human.
Edge cases where the usual advice breaks down
Some situations need a different setup because the normal “connector plus dashboard” advice falls apart.
-
International SEO with country folders → What changes: page and country mapping become messy fast. → What to do instead: standardize country, language, and folder logic in a warehouse or at least in transformation rules before the dashboard layer.
-
Multiple brands with different site structures → What changes: one template can hide important differences. → What to do instead: use a shared metric framework but separate dashboard tabs or pages per brand so the logic stays comparable without forcing identical layouts.
-
Heavy reliance on JavaScript-rendered pages → What changes: Search Console and crawl data may not line up with what the site actually serves. → What to do instead: add a technical SEO layer from a crawler such as Screaming Frog or Sitebulb, and do not use rankings alone to judge performance.
-
Leadership wants a one-page summary → What changes: detail is less useful than direction. → What to do instead: keep one executive page with 5 to 7 metrics, then link to drill-down pages for the SEO team.
-
You need historical snapshots of rankings or SERP features → What changes: many tools overwrite the present view and lose context. → What to do instead: store snapshots on a schedule, ideally daily or weekly, so you can compare changes over time.
-
The site has low traffic → What changes: weekly noise can swamp signals. → What to do instead: report monthly and avoid overreacting to tiny swings.
The pattern here is simple: if the data structure is unstable, automate less at the presentation layer and more at the storage layer. If the audience is simple, reduce the dashboard. If the SEO problem is technical, add crawl data. A single dashboard rarely solves all three at once.
Quick check: if your site has multiple countries, brands, or crawler issues, a default dashboard template is probably the wrong starting point.
How much does automation cost to run in practice?
It costs less to start than to maintain if you keep the stack small, but recurring software and connector fees can exceed the cost of the dashboard tool itself. That is why pricing needs to be thought of as a system, not a single subscription. I would budget for three buckets: dashboard tool, data connector or warehouse, and setup/maintenance time.
The cheapest workable setup is often a free or low-cost dashboard layer plus one paid connector. The more technical setup replaces some connector dependence with warehouse storage and model maintenance. Neither is free in labor. If you have no technical owner, the “cheaper” stack can become expensive because every schema change becomes a manual fix.
Use this rule of thumb: if the dashboard saves less time than it takes to maintain, it is not automation, it is decoration. That sounds blunt because it is. A reporting system should pay back in fewer manual exports, fewer formula fixes, and fewer status meetings spent reconciling numbers.
There is also a hidden cost in bad trust. If one person can make numbers change by editing a filter, the dashboard will be ignored. If a connector breaks once a quarter and nobody notices for a week, the report stops being operational. Those failures are common enough that reliability matters more than chart style.
One honest limit: automation is not the right choice for a tiny site with one monthly report and no recurring decisions. In that case, a simple spreadsheet may be enough. The moment the same report gets built twice, automation starts earning its keep.
Quick check: if you can name the manual task that disappears, you can justify the cost; if you cannot, the stack is probably too much.
FAQ
Can I automate SEO reports with Google Sheets alone?
Yes, if the report is small and the data sources are limited. Sheets works for simple pulls, but it gets brittle when you need multiple properties, cleaner history, or role-based access.
Is Looker Studio enough for SEO dashboards?
Sometimes. It is usually enough for simple reporting with GSC and GA4, but less suitable when you need complex joins, larger datasets, or stricter governance.
How often should an SEO dashboard refresh?
Most teams refresh daily, but the right cadence depends on source lag and business need. Search Console data is not real-time, so a daily dashboard can still be useful even when the source updates later.
Do I need a warehouse for SEO automation?
No, not always. A warehouse becomes more useful when you need multiple data sources, historical snapshots, or consistent joins across many properties.
What is the first thing to automate?
Start with the most repetitive pull in your current report, usually Search Console clicks, GA4 sessions, or rankings by landing page.
Drafted with AI; not yet reviewed by a person.